


 Carleen Eaton
 Grant Fraser
 Eric Smith

Dr. Carleen Eaton
Graphing Quadratic Functions
Slide Duration:Table of Contents
Section 1: Basic Concepts
Variables and Expressions
11m 22s
- Intro0:00
- History of Algebra0:12
- Origin of Word0:21
- Real World Problems0:35
- Definitions0:58
- Variable1:03
- Algebraic Expression1:37
- Operations2:02
- Example 1: Words into Expressions3:02
- Example 2: Words into Expressions5:20
- Example 3: Words into Expressions6:45
- Example 4: Words into Expressions9:46
Order of Operations
15m 59s
- Intro0:00
- Example0:17
- Definition0:57
- Procedure to Evaluate an Arithmetic Expression1:08
- Grouping Symbols (Parentheses, Brackets, Braces)1:19
- Powers1:42
- Multiply/Divide Left to Right1:57
- Add/Subtract Left to Right2:21
- Example: Fraction Bar2:49
- Example 1: Evaluate Arithmetic Expression3:45
- Example 2: Evaluate Arithmetic Expression7:28
- Example 3: Evaluate Arithmetic Expression10:11
- Example 4: Evaluate with Variables13:12
Distributive Property
9m 50s
- Intro0:00
- Distributive Property Statements0:23
- Moving Forward0:49
- Rule for Subtraction1:14
- Reverse Order1:40
- Several Numbers2:17
- Example 1: Evaluate Using Distributive Property2:56
- Example 2: Multiply Using Distributive Property4:10
- Example 3: Simplify Using Distributive Property4:59
- Example 4: Simplify Using Distributive Property7:03
Real Number System
17m 58s
- Intro0:00
- Real Number System0:31
- Natural Numbers0:39
- Whole Numbers1:11
- Integers1:23
- Rational Numbers1:52
- Cannot Divide by Zero2:18
- Decimals2:27
- Example: Terminating or Repeating2:39
- Real Number System, Cont.3:37
- Square Roots3:42
- Examples3:54
- Irrational Numbers4:36
- Examples5:02
- Perfect Square5:54
- Real Number System, Cont.6:49
- Example: Number Line7:02
- Example 1: Which Set of Numbers7:54
- Example 2: Graph on Number Line10:04
- Example 3: Approximate Irrational Number12:47
- Example 4: Order Largest to Smallest13:57
Functions and Graphs
34m 39s
- Intro0:00
- Functions0:15
- Example: Function0:29
- Example: Not Functions (Relations)1:15
- Graphs4:44
- Visual Display4:53
- Example: X and Y5:03
- Coordinate Pairs5:53
- Discrete Function8:19
- Continuous Function8:55
- Vertical Line Test10:55
- Test if Function11:12
- Example: Pass Through Points11:43
- Domain and Range14:13
- Example14:43
- Example 1: Function Given by Table16:24
- Example 2: Cost of Gas18:46
- Example 3: Cost of Gas23:15
- Example 4: Cost of Mail29:07
Section 2: Solving Linear Equations
From Sentences to Equations
16m 5s
- Intro0:00
- Real World Applications0:18
- Strategy0:26
- Using Variables0:32
- Translate Phrases0:48
- Identity Equality Words1:07
- Example 1: Write Equation1:32
- Example 2: Write Equation4:14
- Example 3: Sisters' Ages8:26
- Example 4: Surface Area of Cylinder12:52
Addition and Subtraction Techniques
15m 24s
- Intro0:00
- Techniques0:21
- Addition Principle0:24
- Example0:37
- Subtraction Principle1:44
- Example1:48
- Strategy2:33
- Isolate the Variable2:41
- Example2:55
- Example 1: Solve Equation3:39
- Example 2: Solve Equation5:38
- Example 3: Word Problem7:38
- Example 4: Word Problem11:14
Multiplication and Division Techniques
15m 41s
- Intro0:00
- Isolating the Variable0:08
- Techniques0:34
- Multiplication Principle0:41
- Example0:57
- Division Principle2:32
- Example2:47
- Strategy3:12
- Example3:30
- Opposite Operation3:53
- Example 1: Solve Equation5:07
- Example 2: Solve Equation6:50
- Example 3: Solve Equation10:05
- Example 4: Word Problem12:07
Techniques for Multistep Equations
14m 31s
- Intro0:00
- What are Multistep Equations0:06
- Addition/Subtraction and Multiplication/Division0:31
- Strategy0:43
- Identify Last Operation0:47
- Example 1: Solve Equation1:51
- Example 2: Solve Equation5:27
- Example 3: Find Numbers7:39
- Example 4: Solve Equation11:27
When the Variable is on Both Sides of the Equation
20m 17s
- Intro0:00
- Solving More Complicated Equations0:28
- Distributive Property0:41
- Review of Distributive Property0:55
- Factoring1:28
- Subtracting1:50
- Applying with Addition/Subtraction2:08
- Possible Outcomes2:45
- Exactly One Solution2:52
- No Solution3:08
- True for All Real Numbers4:45
- Identities5:01
- Example 1: Solve Equation6:03
- Example 2: Solve Equation9:08
- Example 3: Solve Equation14:06
- Example 4: Solve Equation17:28
Ratios and Proportion
16m 5s
- Intro0:00
- Definitions0:07
- Ratio0:10
- Different Representations0:14
- Proportion0:33
- Example0:40
- Cross Product1:08
- Cross Multiplication1:32
- Example2:13
- Rates3:33
- Rates in Real Life3:46
- Example 1: Form a Proportion4:43
- Example 2: Cross Multiply7:15
- Example 3: How Long to Drive9:00
- Example 4: Cross Products12:13
Applications of Percents
13m 46s
- Intro0:00
- Definitions0:15
- Percent of Increase0:27
- Percent of Decrease0:34
- Examples0:42
- Sales Tax1:48
- Discount2:44
- Example 1: Temperature Change3:12
- Example 2: Sales Tax5:44
- Example 3: Clothing Discount7:04
- Example 4: Sales and Discount9:15
More Than One Variable
20m 38s
- Intro0:00
- More Than One Variable0:21
- Real Life Examples0:30
- Strategy1:08
- Possible Techniques1:17
- Typical Application1:43
- Solving for a Different Variable1:59
- Example 1: Solve for Y5:06
- Example 2: Solve for Q7:38
- Example 3: Solve for H12:56
- Example 4: Solve for X16:04
Section 3: Functions
Relations
16m 58s
- Intro0:00
- Definition0:04
- Relation0:06
- Table0:18
- Set of Ordered Pairs1:01
- Graph1:38
- Domain and Range2:40
- Example: Relation2:51
- Example: Broader Cases3:48
- Inverse of a Relation4:42
- Example4:59
- Example 1: Relation as Table/Graph6:15
- Example 2: Domain and Range8:41
- Example 3: Table, Graph, Domain, Range10:36
- Example 4: Inverse of a Relation13:36
Functions
19m 27s
- Intro0:00
- Definition0:14
- Review of Relations0:27
- Violation of Function1:43
- Example: Function2:00
- Vertical Line Test3:18
- Example3:41
- Function Notation6:15
- Using f(x)6:26
- Example: Value Assigned7:12
- Example 1: Relation a Function8:10
- Example 2: Relation a Function9:39
- Example 3: Using f(x) Notation12:20
- Example 4: g(x) Notation15:01
Linear Functions
20m 15s
- Intro0:00
- Definition0:07
- Standard Form0:18
- Example0:52
- Graph and Intercepts2:39
- Example: Graph2:48
- X-Intercept2:56
- Y-Intercept3:35
- Graphing Linear Equations4:29
- Example4:47
- Linear Functions7:51
- Example8:15
- Example 1: Linear10:16
- Example 2: Linear Equation12:58
- Example 3: Intercepts14:23
- Example 4: Equation from Intercepts16:47
Section 4: Linear Functions and Their Graphs
Slope and Rate of Change
19m 46s
- Intro0:00
- Rate of Change0:06
- Other Words0:14
- Example0:24
- Slope2:12
- Two Points2:39
- Steepness of a Line2:57
- Possible Slopes4:29
- Positive Slope5:02
- Negative Slope5:29
- Zero Slope (Horizontal Line)6:23
- Undefined Slope (Vertical Line)7:08
- Example 1: Rate of Change of Table8:19
- Example 2: Slope Through Points10:52
- Example 3: Increasing/Decreasing13:06
- Example 4: Slope Through Points16:02
Direct Variation
13m 54s
- Intro0:00
- Definitions0:10
- Constant of Variation k0:21
- Example: Gas and Miles Driven0:59
- Graph1:50
- k is Slope2:04
- Examples2:27
- Applications2:47
- Write, Graph, Solve2:58
- Example 1: Constant of Variation3:11
- Example 2: Graph Direct Variation4:59
- Example 3: Direct Variation6:50
- Example 4: Distance Car Travels9:18
Slope Intercept Form of an Equation
12m 6s
- Intro0:00
- Slope Intercept Form0:12
- m (Slope) and b (Y Intercept)0:31
- Example1:12
- Example 1: Slope Intercept Form Equation2:39
- Example 2: Graph the Equation5:11
- Example 3: Slope Intercept Form Equation6:51
- Example 4: Slope Intercept Form Equation8:50
Point Slope Form of an Equation
9m 7s
- Intro0:00
- Point Slope Form0:07
- Manipulating to Other Forms0:35
- m (Slope), x1 y1 (Point)0:47
- Example 1: Point Slope Form Equation1:03
- Example 2: Point Slope Form Equation2:50
- Example 3: Point Slope Form Equation4:18
- Example 4: Point Slope Form Equation6:50
Parallel Lines and Perpendicular Lines
18m 2s
- Intro0:00
- Parallel Lines0:08
- Example0:15
- Vertical Lines0:40
- Perpendicular Lines1:19
- Negative Reciprocal1:31
- Example2:05
- Example 1: Slope Intercept Form3:25
- Example 2: Parallel or Perpendicular6:15
- Example 3: Slope Intercept Form9:27
- Example 4: Slope Intercept Form12:35
Section 5: Systems of Equations
Graphing Systems of Equations
22m 45s
- Intro0:00
- Systems of Equations0:10
- Definition0:15
- Example0:31
- Solution0:47
- Solving by Graphing1:23
- Points of Intersection1:36
- Example1:56
- Number of Solutions3:09
- Independent3:20
- Dependent3:50
- Inconsistent4:46
- Example 1: Solve by Graphing5:45
- Example 2: Solve by Graphing9:50
- Example 3: Solve by Graphing14:17
- Example 4: Solve by Graphing18:03
Solving by Substituting
22m 41s
- Intro0:00
- Substitution0:09
- Example0:45
- Number of Solutions2:47
- Infinite Solutions3:11
- No Solutions4:28
- Example 1: Solve by Substitution5:44
- Example 2: Solve by Substitution10:01
- Example 3: Solve by Substitution15:17
- Example 4: Solve by Substitution19:41
Solving by Addition and Subtraction
16m 13s
- Intro0:00
- Fundamental Principle0:10
- Example0:23
- Example 1: Solve the System1:52
- Example 2: Solve the System5:53
- Example 3: Solve the System10:15
- Example 4: Solve the System14:08
Section 6: Inequalities
Addition & Subtraction Techniques
11m 34s
- Intro0:00
- Fundamental Principle0:09
- Example0:36
- Solutions of Inequalities1:51
- Inequality1:59
- Set Builder Notation2:02
- Graph on a Number Line2:08
- Examples2:18
- Example 1: Solve the Inequality4:59
- Example 2: Solve the Inequality7:00
- Example 3: Solve the Inequality8:10
- Example 4: Solve the Inequality9:47
Multiplication & Division Techniques
10m 49s
- Intro0:00
- Fundamental Principle0:10
- Only Positive Numbers0:23
- Example0:51
- Fundamental Principle, Cont.2:01
- Negative Numbers2:12
- Reverse Inequality Sign2:28
- Example2:48
- Example 1: Solve the Inequality4:26
- Example 2: Solve the Inequality5:45
- Example 3: Solve the Inequality6:50
- Example 4: Solve the Inequality8:28
Techniques for Multistep Inequalities
16m 56s
- Intro0:00
- Similarity to Multistep Equations0:16
- Negative Numbers0:32
- Example0:49
- Inequalities Containing Grouping Symbols1:24
- Example1:35
- Special Cases2:45
- Example: All Real Numbers3:04
- Example: Empty Set4:10
- Example 1: Solve the Inequality6:05
- Example 2: Solve the Inequality7:39
- Example 3: Solve the Inequality9:57
- Example 4: Solve the Inequality13:56
Compound Inequalities
21m 32s
- Intro0:00
- What is a Compound Inequality0:07
- Joined by 'And' or 'Or'0:16
- Inequalities Combined by 'And'0:36
- Intersection/Overlap0:53
- Example1:08
- Inequalities Combined by 'Or'4:23
- Union4:41
- Example5:27
- Example 1: Solve the Inequality6:39
- Example 2: Solve the Inequality11:30
- Example 3: Solve the Inequality13:43
- Example 4: Solve the Inequality18:19
Equations with Absolute Value
24m 16s
- Intro0:00
- Absolute Value0:06
- Number Line0:22
- Example0:41
- Absolute Value is N1:52
- Absolute Value Function3:17
- Example3:40
- g(x) and f(x)4:31
- Solving Absolute Value Equations6:23
- Absolute Value in Words6:39
- Split Into Two Parts7:58
- Solve Both Equations8:22
- Example 1: Solve the Absolute Value10:34
- Example 2: Solve the Absolute Value13:09
- Example 3: Solve the Absolute Value14:52
- Example 4: Solve the Absolute Value20:23
Inequalities with Absolute Values
17m 37s
- Intro0:00
- Inequalities of the Form |x|< n0:07
- Values that Satisfy Both Inequalities0:46
- Example1:27
- Inequalities of the Form |x|> n3:58
- Values that Satisfy Either Inequalities4:19
- Example4:47
- Example 1: Solve the Inequality6:38
- Example 2: Solve the Inequality9:54
- Example 3: Solve the Inequality12:05
- Example 4: Solve the Inequality14:50
Graphing Inequalities with Two Variables
24m 33s
- Intro0:00
- Graph0:08
- Half Plane and Boundary0:51
- Technique for Graphing1:57
- Graph Equation2:01
- Solid Line or Dashed Line2:07
- Example2:32
- Choosing a Test Point5:10
- Example5:26
- Example 1: Solve the Inequality7:49
- Example 2: Solve the Inequality11:37
- Example 3: Solve the Inequality15:44
- Example 4: Solve the Inequality19:10
Graphing Systems of Inequalities
24m 4s
- Intro0:00
- System of Inequalities0:05
- Example0:22
- Solving a System of Inequalities0:38
- Solution Set0:46
- Graph Each Inequality0:57
- Area of Overlap1:45
- Example 1: Solve the System of Inequalities2:44
- Example 2: Solve the System of Inequalities6:33
- Example 3: Solve the System of Inequalities11:40
- Example 4: Solve the System of Inequalities17:36
Section 7: Polynomials
Multiplying Monomials
22m 19s
- Intro0:00
- What is a Monomial0:09
- Examples0:17
- Power0:55
- Base and Exponent1:52
- Properties of Exponents2:16
- Add Exponents2:25
- Multiply Exponents4:00
- Product Exponent4:39
- Simplified Form7:26
- Examples7:47
- Example 1: Simplify the Monomial8:26
- Example 2: Simplify the Monomial10:32
- Example 3: Simplify the Monomial12:48
- Example 4: Simplify the Monomial17:33
Dividing Monomials
24m 2s
- Intro0:00
- Properties of Exponents0:05
- Dividing with Same Base0:15
- Example0:53
- Quotient Raised to Power2:22
- Example2:53
- Raising to 0 Power4:00
- Example4:21
- Negative Exponents5:45
- Example6:05
- Example 1: Simplify the Monomial7:33
- Example 2: Simplify the Monomial14:56
- Example 3: Simplify the Monomial13:30
- Example 4: Simplify the Monomial17:35
Polynomials
8m 56s
- Intro0:00
- What is a Polynomial0:07
- Monomial0:40
- Binomial1:15
- Trinomial1:25
- Degree of a Polynomial1:56
- Example: Degree of Monomial2:13
- Example: Degree of Polynomial2:47
- Ordering Polynomials3:32
- Example3:47
- Example 1: Trinomial or Binomial4:44
- Example 2: Find the Degree5:27
- Example 3: Increasing Powers6:11
- Example 4: Decreasing Powers7:27
Adding and Subtracting Polynomials
15m 51s
- Intro0:00
- Adding Polynomials0:07
- Like Terms0:18
- Example1:02
- Subtracting Polynomials2:44
- Example2:58
- Example 1: Add Polynomials5:11
- Example 2: Subtract Polynomials7:30
- Example 3: Add and Subtract9:35
- Example 4: Add and Subtract12:09
Multiplying Polynomials by Monomials
18m 17s
- Intro0:00
- Distributive Property0:07
- Example0:54
- Solving Equations1:36
- Isolate Variable and Solve1:46
- Example 1: Multiply1:59
- Example 2: Simplify3:33
- Example 3: Simplify7:20
- Example 4: Solve13:37
Multiplying Polynomials
18m 2s
- Intro0:00
- Distributive Property0:08
- Example0:54
- FOIL Method2:44
- First, Outer, Inner, Last3:20
- Example 1: Multiply5:32
- Example 2: Multiply7:27
- Example 3: Multiply9:41
- Example 4: Multiply13:56
Special Products
17m
- Intro0:00
- Square of a Sum0:06
- Example1:09
- Square of a Difference2:46
- Example3:22
- Difference of Two Squares4:50
- Example5:31
- Example 1: Multiply6:24
- Example 2: Multiply8:34
- Example 3: Multiply11:03
- Example 4: Multiply12:54
Section 8: Factoring
Special Product
17m 51s
- Intro0:00
- Prime and Composite Numbers0:09
- Prime Number0:12
- Composite Number0:42
- Factored Forms1:39
- Prime Factored Form1:40
- Factored Form2:21
- Greatest Common Factor3:55
- Example: GCF for Number4:19
- Example: GCF for Monomial6:00
- Example 1: Prime Factored Form7:51
- Example 2: Factored Form9:34
- Example 3: GCF11:12
- Example 4: GCF13:28
Factoring Using Greatest Common Factor
25m 21s
- Intro0:00
- Distributive Property0:05
- Example: Binomial0:49
- Example: Trinomial2:18
- Factoring by Grouping4:17
- Example: Four Terms4:40
- Zero Product Property8:21
- Example9:01
- Example 1: Factor the Polynomial10:38
- Example 2: Factor the Polynomial13:43
- Example 3: Factor the Polynomial19:59
- Example 4: Solve the Polynomial22:58
Factoring Trinomials with Leading Coefficient of 1
27m 11s
- Intro0:00
- Factoring Trinomials0:07
- Leading Coefficient0:11
- Example1:20
- Rules for Signs2:42
- P and Q Both Positive2:55
- P and Q Both Negative3:39
- P and Q Opposite Signs4:30
- Solving Equations5:18
- Example6:44
- Example 1: Factor the Polynomial7:41
- Example 2: Factor the Polynomial12:33
- Example 3: Factor the Polynomial16:39
- Example 4: Solve the Polynomial21:35
Factoring General Trinomials
46m 9s
- Intro0:00
- Factoring Trinomials0:15
- Example2:42
- Grouping7:20
- Example7:35
- Rules for Signs10:51
- Same as Leading Coefficient is 111:05
- Greatest Common Factor12:29
- Use Whenever Possible12:41
- Example12:59
- Prime Polynomials13:58
- Example14:33
- Solving Equations16:55
- Example17:25
- Example 1: Factor the Polynomial18:46
- Example 2: Factor the Polynomial25:23
- Example 3: Factor the Polynomial32:37
- Example 4: Solve the Polynomial36:18
Factoring the Difference of Two Squares
24m 3s
- Intro0:00
- Difference of Two Squares0:08
- Example0:36
- Factoring Using Several Techniques2:23
- Factoring the GCF2:30
- Example3:22
- Solving Equations5:24
- Example5:50
- Example 1: Factor the Polynomial7:34
- Example 2: Factor the Polynomial9:11
- Example 3: Factor the Polynomial12:00
- Example 4: Solve the Polynomial18:31
Factoring Perfect Squares
18m 10s
- Intro0:00
- Perfect Squares0:07
- Example: Perfect Square Trinomials1:12
- Solving Equations2:57
- Square Root Property3:09
- Example3:28
- Example 1: Factor the Polynomial5:09
- Example 2: Factor the Polynomial6:13
- Example 3: Solve the Polynomial8:43
- Example 4: Solve the Polynomial13:35
Section 9: Quadratic Functions
Graphing Quadratic Functions
35m 45s
- Intro0:00
- Parabolas0:14
- Standard Form of Quadratic Function0:28
- Examples1:05
- Absolute Value of 'a'2:19
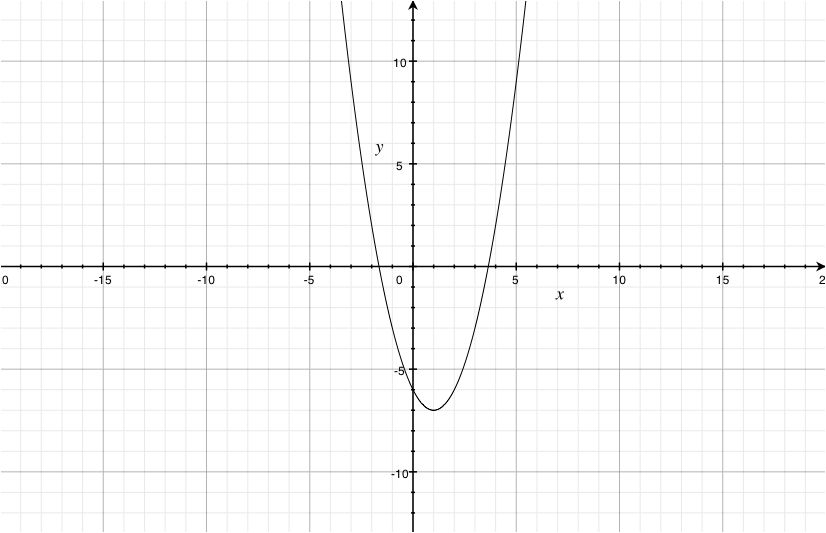
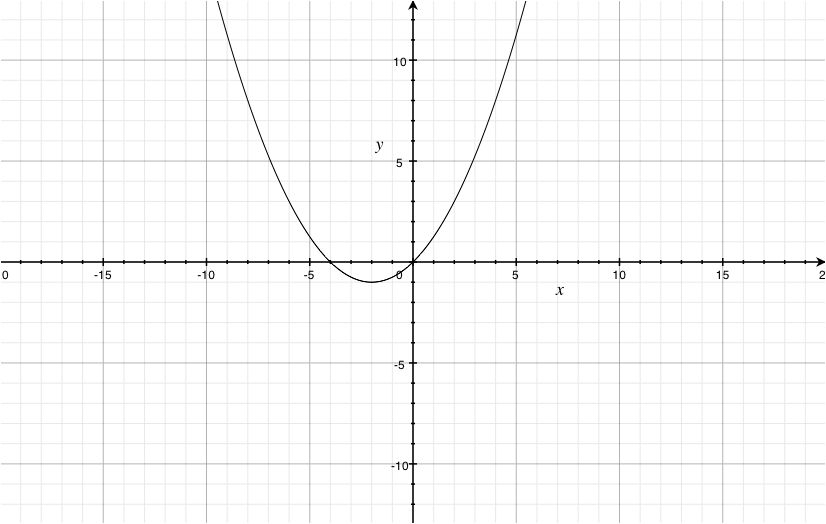
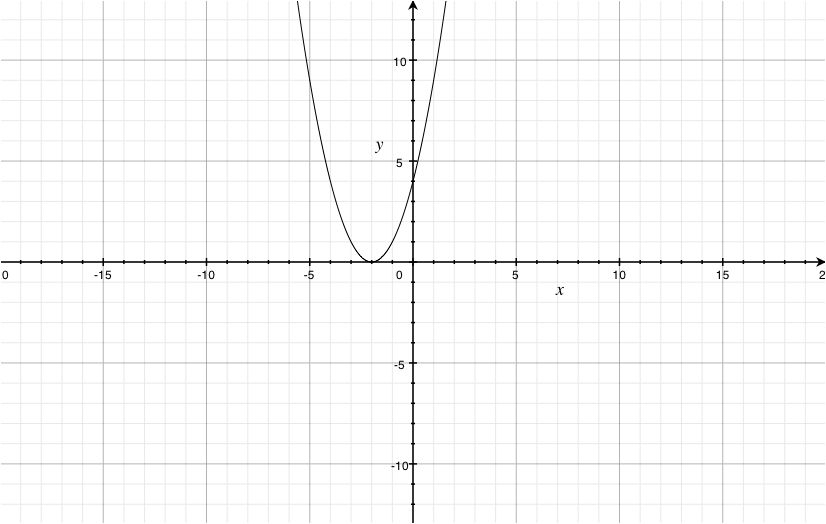
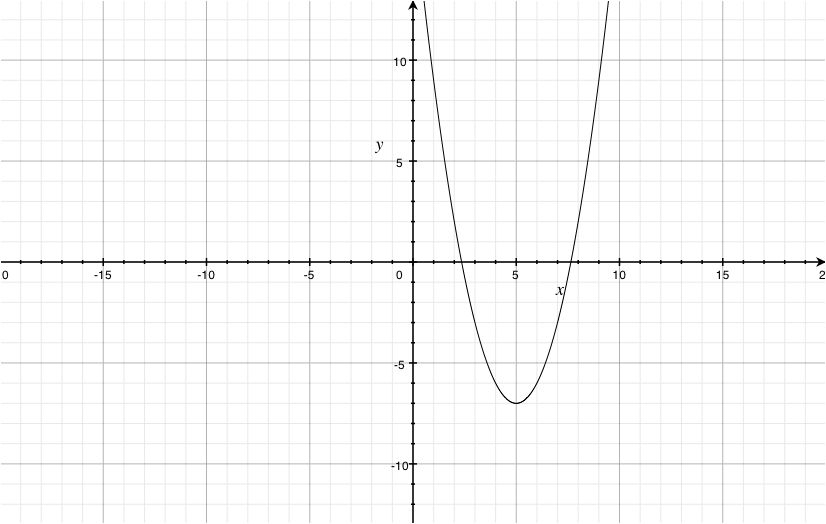
- Parabolas That Open Upward3:14
- Minimum3:48
- Example3:57
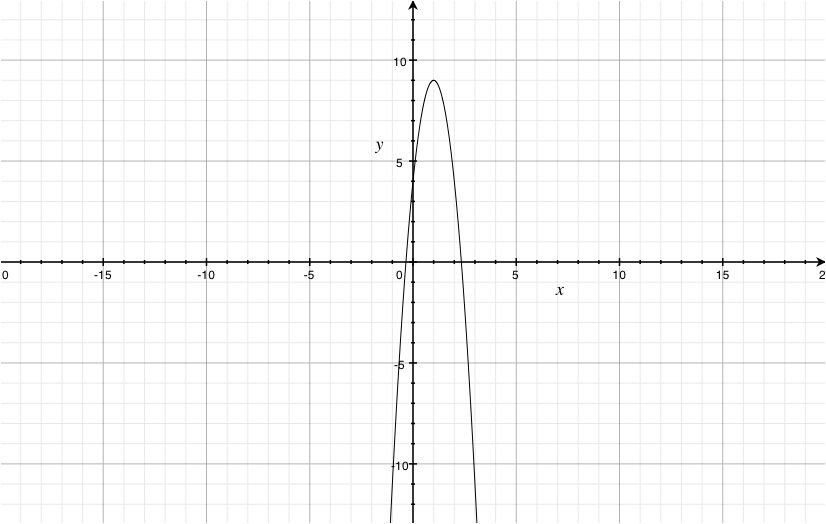
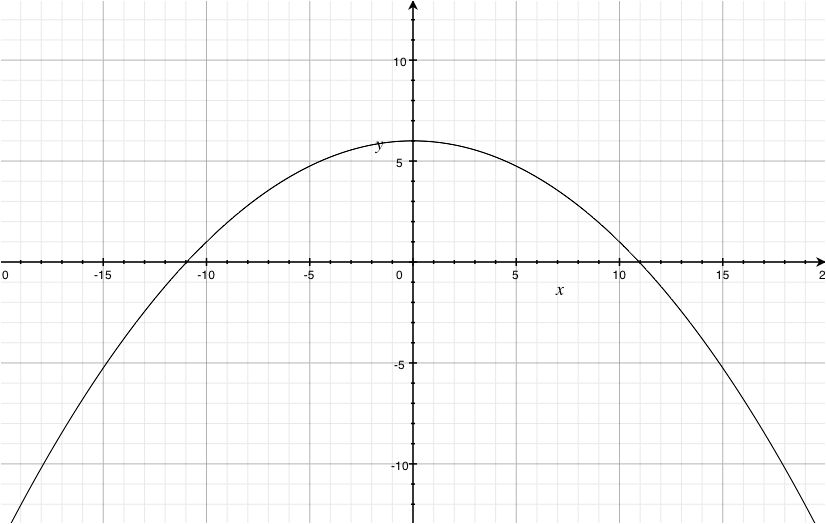
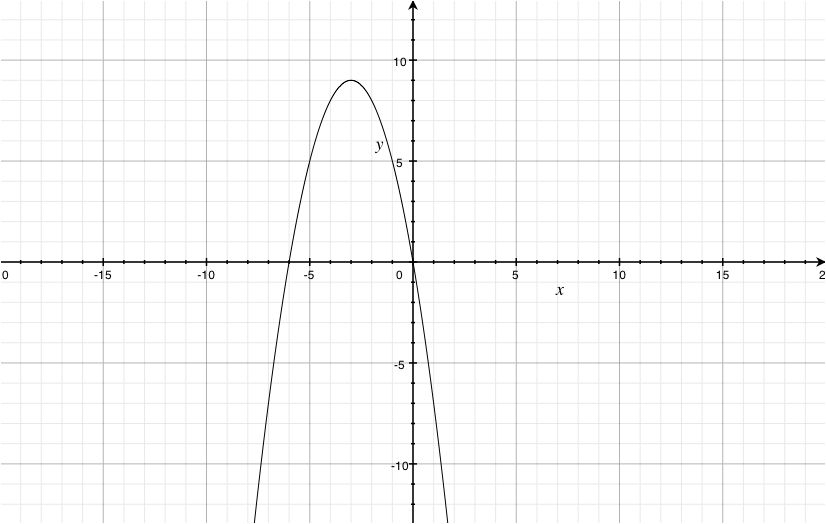
- Parabolas That Open Downward6:57
- Example7:17
- Maximum9:23
- Vertex9:53
- Example10:40
- Axis of Symmetry14:16
- Example15:03
- Example 1: Graph the Quadratic19:54
- Example 2: Graph the Quadratic24:12
- Example 3: Vertex Maximum or Minimum28:32
- Example 4: Axis of Symmetry31:13
Solving Equations by Graphing
40m 42s
- Intro0:00
- Solving a Quadratic Equation0:08
- Example0:56
- Two Distinct Solutions/Roots8:10
- Roots8:23
- Example: Graphs8:40
- One Double Root9:19
- Example: One X-Intercept9:54
- No Real Roots14:03
- Example14:53
- Estimating Solutions18:41
- Example: Not Integers19:18
- Example 1: Solve by Graphing20:18
- Example 2: Solve by Graphing26:36
- Example 3: Solve by Graphing30:18
- Example 4: Estimate by Graphing34:59
Solving Equations by Completing the Square
28m 13s
- Intro0:00
- Perfect Square Trinomials0:15
- Example0:36
- Completing the Square4:55
- Example6:20
- Completing the Square to Solve Equations9:19
- Example9:40
- When the Leading Coefficient is Not 113:17
- Example14:01
- Example 1: Solve the Equation15:05
- Example 2: Complete the Square20:16
- Example 3: Solve by Completing the Square22:31
- Example 4: Solve by Completing the Square25:02
Solving Equations Using the Quadratic Formula
17m 17s
- Intro0:00
- Quadratic Formula0:17
- Standard Form0:24
- Example1:00
- Discriminant3:14
- Two Solutions and Both Real3:40
- One Real Solution4:07
- No Real Solutions4:28
- Example 1: Solve the Equation6:25
- Example 2: Solve the Equation8:42
- Example 3: Solve the Equation12:02
- Example 4: Number of Real Roots15:23
Section 10: Radical Expressions and Equations
Simplifying Radical Expressions
41m 30s
- Intro0:00
- Radical Expression0:12
- Example: Radicand Simplest Form0:29
- Example: Not Simplest Form1:16
- Principal Square Root (Positive)2:43
- Product Property3:40
- Examples4:05
- Square Roots of Variables with Even Powers7:01
- Eliminate Radical Sign7:42
- Divide Exponent by 27:57
- Absolute Value of Result8:29
- Examples8:52
- Quotient Rule14:12
- Example14:31
- Rationalizing Denominators16:08
- Example16:43
- Conjugates18:33
- Example19:53
- Simplest Radical Form20:58
- Three Criteria21:10
- Example 1: Simplify Expression21:57
- Example 2: Simplify Expression25:12
- Example 3: Simplify Expression31:37
- Example 4: Simplify Expression35:29
Operations with Radical Expressions
21m 52s
- Intro0:00
- Adding and Subtracting Radical Expressions0:13
- Like Radicals0:28
- Distributive Property1:10
- Multiplying Radical Expressions4:24
- Example: Use FOIL4:44
- Example 1: Simplify Expression7:07
- Example 2: Simplify Expression8:51
- Example 3: Simplify Expression12:14
- Example 4: Simplify Expression16:06
Solving Radical Equations
27m
- Intro0:00
- Radical Equations0:15
- Examples0:30
- Solving a Radical Equation1:13
- Isolate Radical1:18
- Square Both Sides1:38
- Example1:44
- Extraneous Solutions2:57
- Example: Check Solutions3:30
- Example 1: Solve Equation6:29
- Example 2: Solve Equation9:52
- Example 3: Solve Equation14:29
- Example 4: Solve Equation20:53
Pythagorean Theorem
17m 24s
- Intro0:00
- Right Triangles0:06
- Vertex0:32
- Hypotenuse0:56
- Legs1:11
- Pythagorean Theorem1:21
- Graphical Representation1:37
- Example2:39
- Pythagorean Triples3:40
- Example3:56
- Converse of the Pythagorean Theorem4:36
- Example6:23
- Example 1: Length of Hypotenuse7:24
- Example 2: Length of Legs9:02
- Example 3: Area of Triangle12:00
- Example 4: Length of Side14:59
Distance Formula
26m 50s
- Intro0:00
- Distance Formula0:09
- Similarity to Pythagorean Theorem0:21
- Missing Coordinates5:50
- Example6:22
- Example 1: Distance Between Points11:43
- Example 2: Distance Between Points14:05
- Example 3: Distance Between Points18:18
- Example 4: Missing Coordinate21:57
Section 11: Rational Expressions and Equations
Inverse Variation
24m 13s
- Intro0:00
- Direct Variation0:12
- Inverse Variation0:24
- Constant of Variation k0:50
- Y Varies Inversely as X0:59
- Graphing Inverse Variation3:09
- Real World Applications3:24
- Example3:59
- Product Rule10:19
- Alternate Form11:10
- Finding Missing 4th Point11:24
- Example 1: Graph Inverse Variation11:36
- Example 2: Graph Inverse Variation14:47
- Example 3: Find Missing Point19:39
- Example 4: Find Missing Point21:53
Rational Expressions
34m 22s
- Intro0:00
- Rational Expressions0:10
- Examples0:28
- Excluded Values1:03
- Dividing by 01:29
- Example2:49
- Simplifying Rational Expressions7:12
- Eliminating the GCF7:17
- Example: Regular Fraction7:30
- Example: Rational Expression8:12
- Simplifying and Excluded Values10:15
- Original Rational Expression10:24
- Example10:47
- Example 1: Find Excluded Values13:47
- Example 2: Simplify and Find Excluded Values16:10
- Example 3: Simplify and Find Excluded Values22:04
- Example 4: Simplify and Find Excluded Values26:29
Multiplying Rational Expressions
22m 58s
- Intro0:00
- Procedure0:08
- Examples0:29
- Cancel Before Multiplication1:53
- Example2:04
- Rational Expressions Containing Polynomials3:18
- Example3:46
- Example 1: Multiply Rational Expressions6:04
- Example 2: Multiply Rational Expressions9:11
- Example 3: Multiply Rational Expressions11:19
- Example 4: Multiply Rational Expressions17:36
Dividing Rational Expressions
21m 49s
- Intro0:00
- Procedure0:10
- Reciprocal of Expression0:22
- Example: Regular Fractions0:44
- Example: Rational Expressions1:46
- Cancel Before Multiplying3:23
- Why Cancel3:45
- Example4:15
- Rational Expressions Containing Polynomials6:46
- Example7:06
- Example 1: Divide Rational Expressions9:15
- Example 2: Divide Rational Expressions13:11
- Example 3: Divide Rational Expressions15:39
Dividing Polynomials
35m 57s
- Intro0:00
- Dividing a Polynomial by a Monomial0:11
- Example: Regular Fractions0:36
- Example: Polynomials1:24
- Dividing a Polynomial by a Binomial2:56
- Example: Dividend and Divisor3:30
- Long Division5:28
- Example: Regular Numbers5:49
- Example: Polynomials7:17
- Missing Terms12:20
- Definition12:40
- Example12:55
- Example 1: Divide the Polynomials18:42
- Example 2: Divide the Polynomials20:54
- Example 3: Divide the Polynomials23:28
- Example 4: Divide the Polynomials28:52
Adding and Subtracting Rational Expressions with Like Denominators
17m 38s
- Intro0:00
- Adding with Like Denominators0:09
- Example: Regular Numbers0:19
- Example: Rational Expressions1:05
- Subtracting with Like Denominators2:35
- Example: Regular Fractions2:52
- Example: Rational Expressions3:05
- Denominators That Are Additive Inverses4:08
- What Are Additive Inverses4:35
- Example5:53
- Example 1: Add Rational Expressions7:54
- Example 2: Subtract Rational Expressions8:43
- Example 3: Add Rational Expressions10:39
- Example 4: Subtract Rational Expressions11:48
Adding and Subtracting Rational Expressions with Unlike Denominators
37m 16s
- Intro0:00
- Least Common Multiple of Polynomials0:21
- Example: Regular Fractions0:42
- Example: Rational Expressions5:18
- Equivalent Rational Expressions Using LCM7:23
- Example8:09
- Adding and Subtracting14:24
- Summary of Techniques14:32
- Example 1: Find the LCM15:09
- Example 2: Add Rational Expressions17:53
- Example 3: Subtract Rational Expressions22:19
- Example 4: Add Rational Expressions30:44
Complex Fractions
25m 38s
- Intro0:00
- Mixed Expressions0:10
- Analogy to Mixed Fractions0:23
- Polynomial and Rational Expression0:59
- Example: Combining1:55
- Converting to Rational Expression2:29
- Complex Fraction5:16
- Examples5:30
- Simplifying Complex Fractions6:08
- Example6:27
- Example 1: Write as Rational Expression9:43
- Example 2: Simplify Complex Fractions12:44
- Example 3: Simplify Complex Fractions15:03
- Example 4: Simplify Complex Fractions19:55
Rational Equations
38m 9s
- Intro0:00
- Definition0:11
- Example: Cross Multiplication0:39
- Example: Rational Expressions1:13
- Solving Rational Equations3:12
- Multiply by LCM of Denominators3:33
- Example4:02
- Work Problems7:19
- Example: Complete a Project8:17
- Extraneous Solutions12:41
- Check All Solutions13:18
- Example13:54
- Example 1: Solve Rational Equation17:28
- Example 2: Solve Rational Equation19:45
- Example 3: Work Problem27:15
- Example 4: Solve Rational Equation31:10
Loading...
This is a quick preview of the lesson. For full access, please Log In or Sign up.
For more information, please see full course syllabus of Algebra 1
For more information, please see full course syllabus of Algebra 1
Share this knowledge with your friends!

Copy & Paste this embed code into your website’s HTML
Please ensure that your website editor is in text mode when you paste the code.(In Wordpress, the mode button is on the top right corner.)
×
Since this lesson is not free, only the preview will appear on your website.
- - Allow users to view the embedded video in full-size.
 Answer Engine
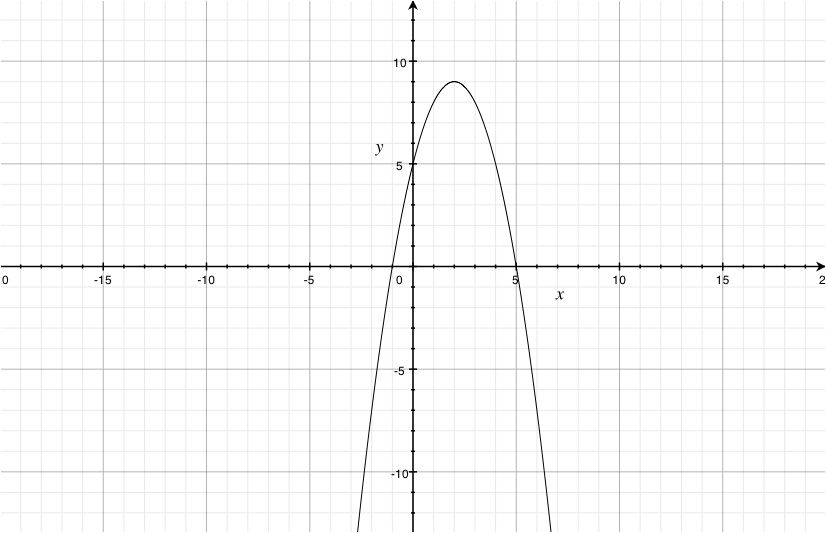


1 answer
Sun May 1, 2016 2:35 PM
Post by Kenosha Fox on April 28, 2016
I'm confused....in solving parabolas that open both upward and downward,do I always keep "a",which is sometimes 1 if there isn't a number in front of the "X", in the equation "ax+b...." positive?Weither or not if my number for "a" is positive or negative?
2 answers
Last reply by: Jessie Carrillo
Mon Feb 1, 2016 11:28 AM
Post by Jessie Carrillo on January 27, 2016
On example II. How did you get a negative Y value when you substituted -3 into Y=-x^2-4x-4?
1 answer
Sat Jul 27, 2013 10:36 AM
Post by Diana Del Angel on July 26, 2013
can you explain how you got the points to plot?
2 answers
Sat Jun 22, 2013 11:24 AM
Post by Taylor Wright on June 22, 2013
Can a parabola not open horizontally?
1 answer
Mon Nov 19, 2012 11:42 PM
Post by Erica Rapetti on November 19, 2012
I am confused how you got Y=-x* -2x+1
NOTE: * = the exponent 2